
Introduction
Slow websites lose visitors before content even loads. Google reports that 53% of mobile users abandon sites taking longer than three seconds to respond. Server response time determines how quickly your hosting environment processes requests and delivers data to browsers.
Every millisecond counts when search engines evaluate user experience signals. A delayed server response triggers cascading performance issues affecting Core Web Vitals, bounce rates, and conversion metrics. Site owners often overlook this foundational speed factor while optimising images or compressing files.
This guide reveals practical methods to diagnose response delays, implement caching strategies, and select infrastructure that supports fast delivery. You’ll learn how Drip Ranks helps businesses achieve sub 200ms response times through technical audits and managed optimisation services. Expect actionable insights covering hosting configurations, database tuning, CDN integration, and monitoring protocols.
What Is Server Response Time?
Server response time measures the duration between a browser sending an HTTP request and receiving the first byte of data from your hosting server. This metric appears as Time to First Byte (TTFB) in performance analysis tools.
The measurement includes DNS lookup duration, connection establishment, SSL handshake completion, and backend processing cycles. A typical TTFB under 200 milliseconds indicates healthy infrastructure, while values exceeding 600ms signal optimisation opportunities. Google PageSpeed Insights flags slow server responses as critical issues requiring immediate attention.
Web servers process requests through multiple layers including firewalls, load balancers, application logic, and database queries. Each component adds latency that compounds into total response delay. Understanding this chain helps identify specific bottlenecks preventing optimal delivery speeds.
Why Server Response Affects SEO Rankings
Google’s ranking algorithms prioritise sites delivering fast, reliable experiences across devices. Server response directly impacts Core Web Vitals metrics including Largest Contentful Paint and First Input Delay measurements, which are commonly evaluated during an SEO audit.
Search crawlers allocate limited time budgets for each domain during indexing operations. Slow responding servers prevent complete page discovery, reducing indexed content volume and ranking potential. Sites consistently delivering sub 300ms responses enable thorough crawling and better search visibility.
User behavior metrics suffer when visitors encounter loading delays before content appears. High bounce rates and low engagement signals tell search engines that pages fail meeting user needs. Fast server responses create positive first impressions that encourage exploration and interaction.
How Server Response Time Works
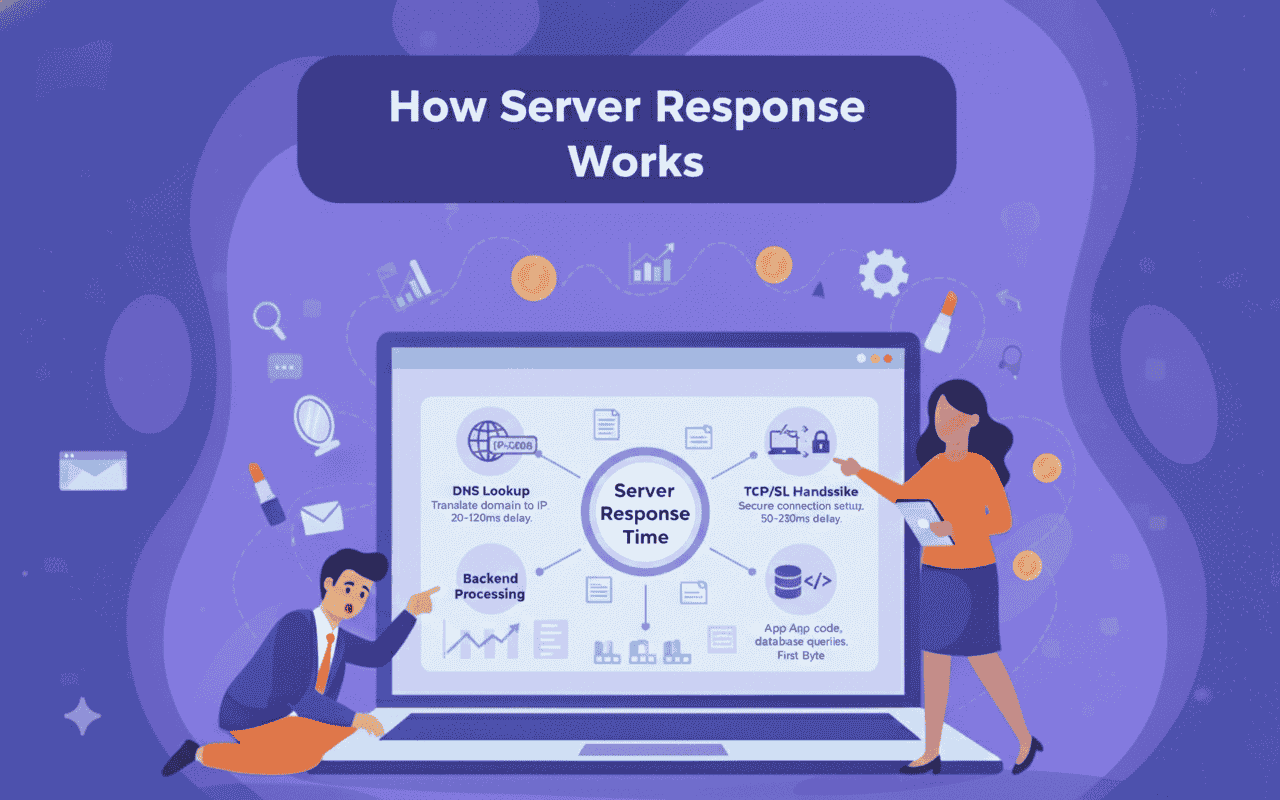
When browsers request web pages, DNS servers translate domain names into IP addresses directing traffic to specific hosting locations. This lookup process adds 20-120 milliseconds depending on nameserver proximity and caching status.
TCP connections establish communication channels between browsers and servers through three way handshakes. SSL/TLS encryption adds another negotiation round for HTTPS sites, contributing 50-200ms to total response time. These protocol requirements occur before any content generation begins.
Backend systems execute application code, query databases, and assemble HTML documents for delivery. Inefficient queries, unoptimised scripts, and resource intensive operations extend processing duration significantly. The server finally transmits the first byte after completing all preparation steps.
Measuring Your Current Response Speed
Google Page Speed Insights provides TTFB measurements within its diagnostic reports under the “Reduce server response times” recommendation. Enter your URL to receive desktop and mobile analysis with specific timing breakdowns.
WebPageTest offers detailed waterfall charts showing DNS resolution, connection timing, SSL negotiation, and backend processing separately. Set test locations matching your target audience geography for accurate real world measurements. Run multiple tests to account for variability and establish baseline averages.
Chrome DevTools Network tab displays timing information for every resource request when inspecting live pages. The “Waiting (TTFB)” column reveals server response duration for each file. Filter by document type to focus on initial HTML delivery timing.
Proven Strategies to Reduce Response Time
Upgrade Hosting Infrastructure
Shared hosting environments allocate limited CPU and memory resources across hundreds of sites. Dedicated servers or virtual private servers provide isolated resources preventing neighbor site activity from impacting your performance.
Managed WordPress hosts like WP Engine and Kinsta optimise server configurations specifically for content management system requirements. These platforms implement object caching, PHP version management, and security hardening by default. Premium hosting typically reduces TTFB by 200-400ms compared to budget shared plans.
Implement Robust Caching Systems
Server side caching stores pre generated HTML versions of dynamic pages, eliminating database queries and PHP execution for repeat visitors. WordPress plugins like WP Rocket and W3 Total Cache create cached copies served instantly, which also supports smoother JavaScript SEO performance.
Object caching with Redis or Memcached stores database query results in memory for rapid retrieval. This approach benefits sites with complex queries or high traffic volumes. Opcode caching through OPcache compiles PHP scripts once rather than on every request.
Browser caching instructs visitors’ devices to store static resources locally for specified durations. Properly configured cache headers reduce server requests by 60-80% for returning users. Set long expiration times for images, stylesheets, and JavaScript files that change infrequently.
Optimise Database Performance
Database queries often represent the largest contributor to backend processing time. Identify slow queries using tools like Query Monitor or MySQL slow query logs. Add indexes to frequently searched columns and eliminate unnecessary JOIN operations.
Remove post revisions, spam comments, and transient data cluttering WordPress databases. Plugins like WP Optimise automate cleanup processes and table optimisation. Schedule weekly maintenance to prevent bloat accumulation over time.
Upgrade database software to current versions supporting improved query engines and caching mechanisms. MySQL 8.0 delivers significant performance improvements over 5.7 releases. Consider managed database services like Amason RDS for automatic scaling and maintenance.
Deploy Content Delivery Networks
CDNs distribute static assets across global server networks positioned near end users. Cloudflare, Fastly, and Amason CloudFront cache files at edge locations reducing geographic latency.
Modern CDNs offer edge computing capabilities executing server side logic closer to visitors. Cloudflare Workers and CloudFront Functions handle dynamic content generation without routing requests to origin servers. This architecture dramatically reduces TTFB for distributed audiences.
Configure CDN purging rules to clear outdated cached versions when publishing updates. Use cache tags or surrogate keys for granular control over invalidation processes. Implement stale while revalidate headers serving cached content while fetching fresh versions in the background.
Common Response Time Mistakes
Many site owners enable excessive plugins creating redundant functionality and resource conflicts. Each active plugin adds code execution overhead during page generation. Audit installed extensions quarterly and remove unused or redundant tools.
Ignoring PHP version updates leaves sites running outdated interpreters lacking performance optimisations. PHP 8.2 executes code 30-50% faster than version 7.4 while offering improved memory management. Test compatibility and upgrade regularly to maintain optimal processing speeds.
Hosting websites on servers geographically distant from target audiences introduces unavoidable latency. A site hosted in Europe serving primarily American visitors experiences 100-200ms baseline delay from round trip distances. Choose data center locations matching audience concentration areas.
External resource dependencies like social media feeds, advertising networks, and third party scripts introduce uncontrolled latency. Each external request blocks page rendering while waiting for responses from servers you don’t control. Minimise external dependencies or load them asynchronously.
Essential Monitoring and Testing Tools
GTmetrix combines Google Lighthouse metrics with waterfall visualisations showing resource loading sequences. The platform tracks historical performance trends and sends alerts when response times exceed defined thresholds, similar to how Semrush provides performance insights.
Pingdom offers uptime monitoring alongside performance testing from multiple global locations. Set up transaction monitoring to test complex user workflows like checkout processes or form submissions. Receive instant notifications when issues arise.
New Relic provides application performance monitoring revealing code level bottlenecks and database query inefficiencies. The platform tracks server resource utilisation, transaction traces, and error rates. Development teams use these insights to optimise application logic and infrastructure configurations.
UptimeRobot monitors website availability and response times every five minutes from various geographic regions. Free plans support up to 50 monitors with email and SMS alerting. Paid tiers add status page hosting and advanced reporting features.

Advanced Response Optimisation Techniques
HTTP/2 and HTTP/3 Protocol Adoption
Modern protocols multiplex multiple requests over single connections eliminating overhead from repeated handshakes. HTTP/2 supports header compression and server push capabilities reducing total data transfer volumes.
HTTP/3 operates over QUIC transport providing faster connection establishment and better handling of packet loss. Enable these protocols through server configuration or CDN settings. Most modern hosting platforms support HTTP/2 by default.
Lazy Loading Dynamic Content
Defer non critical resource loading until users scroll to relevant page sections. Images, videos, and embedded content load on demand rather than during initial page generation. This approach reduces server processing requirements and initial response payloads.
Implement native lazy loading with HTML loading attributes or JavaScript intersection observers. Critical above the fold content loads immediately while below the fold elements wait for user interaction. Balance user experience with performance optimisation goals.
Asynchronous Processing Workflows
Move resource intensive operations like image processing, email sending, and report generation to background queue systems. Tools like Laravel Horizon or WordPress Cron handle tasks outside primary request cycles.
API requests and third party integrations execute asynchronously preventing delays in page delivery. Users receive immediate responses while backend processes complete independently. This architecture maintains fast response times regardless of complex operations.
How Drip Ranks Accelerates Server Performance
Comprehensive technical audits identify specific bottlenecks limiting your site’s response capabilities. Our team analyses hosting configurations, database efficiency, caching implementation, and code optimisation opportunities.
Managed optimisation services implement proven speed enhancements including CDN setup, object caching deployment, and database tuning. We monitor performance continuously and adjust configurations as traffic patterns evolve.
Enterprise clients benefit from dedicated infrastructure consulting covering server selection, load balancing architecture, and scaling strategies. Our partnerships with premium hosting providers ensure optimal configurations from initial deployment.
Monthly performance reports track TTFB improvements, Core Web Vitals scores, and competitive benchmarking against industry standards. Transparent metrics demonstrate ROI from optimisation investments and guide ongoing enhancement priorities.
Server Response Time Benchmarks by Industry
E-commerce sites should target TTFB under 300ms to prevent cart abandonment during peak shopping periods. Amason reports that every 100ms delay costs 1% in sales revenue. Optimised product pages load within 400-600ms total duration.
News and media websites require sub 200ms responses to support high concurrent visitor volumes. Content delivery networks become essential for global audiences accessing breaking news simultaneously. Leading publishers achieve 150ms average TTFB through distributed caching.
Software as a service platforms serving business applications need consistent sub 400ms responses to maintain productivity perception. Dashboard interfaces loading slowly frustrate users and increase churn rates. Backend API optimisation becomes critical for complex applications.
Small business websites targeting local markets can accept 400-600ms TTFB when using quality shared hosting. Budget constraints often limit infrastructure investments, making optimisation techniques like caching and image compression more valuable.
Future Trends in Server Response Optimisation
Edge computing pushes application logic closer to end users through globally distributed serverless platforms. Vercel Edge Functions and Netlify Edge Handlers execute code within milliseconds of visitor locations. This architecture eliminates traditional server response latency entirely.
Artificial intelligence predicts traffic patterns and pre generates content before requests arrive. Machine learning models identify high demand pages and proactively cache them across CDN networks. Predictive optimisation reduces response times for anticipated visitor behavior.
5G mobile networks provide faster connection establishment reducing cellular latency contributions to total page load times. Server response optimisation becomes even more critical as network speeds improve and users expect instant experiences.
Green hosting initiatives focus on energy efficient data centers powered by renewable sources. Sustainable infrastructure often delivers performance benefits through modern hardware and optimised cooling systems. Environmental responsibility aligns with technical excellence.
Final Recommendations
Most SaaS, B2B, and agency teams treat site speed the same way they treat SEO: tweak a few settings, hope performance improves, and wonder why rankings and conversions stay flat. At DripRanks, we knew there had to be a better way. So we built a system, not a service.
Forensic performance audits expose exactly where server response time is leaking revenue and crawl efficiency. Intent aware optimisation ensures speed improvements support every stage of the buyer journey, not just vanity metrics. Scalable technical automation compounds gains without adding operational complexity. The result? Faster indexing, higher engagement, and predictable pipeline growth not guesswork.
DripRanks specialises in performance led technical SEO that turns infrastructure into a growth asset. We identify bottlenecks, implement proven server side optimisations, and continuously monitor impact so speed improvements translate into rankings and revenue. Contact us today for a complimentary server response analysis and discover how a system-driven approach to performance can accelerate your organic growth.