
Every website owner has experienced that sinking feeling when a page breaks or traffic suddenly drops. Behind every slow load time, failed checkout, or broken link sits a clue waiting to be discovered.
Error logs contain those clues. These digital footprints track every malfunction, security threat, and performance bottleneck your website encounters. They reveal exactly what went wrong, when it happened, and often why.
Most site owners ignore error logs until disaster strikes. That’s a costly mistake. Search engines penalise sites with recurring errors, and users abandon pages that malfunction. One unchecked error can cost you thousands in lost revenue and damaged search rankings.
This guide shows you how to access, interpret, and fix error logs before they harm your business. You’ll learn which errors matter most, how to automate monitoring, and when to escalate issues to developers. Whether you run WordPress, Shopify, or custom platforms, you’ll walk away with actionable steps to protect your site’s health and SEO performance.
What Are Error Logs
Error logs are automated records that capture technical failures within your website or server infrastructure. Every time a script fails, a database query breaks, or a user hits a dead link, the system writes that event to a log file, which is essential server response seo analysis.
These files contain timestamps, error codes, affected URLs, and diagnostic messages. Think of them as your website’s medical records. They document symptoms like 404 errors, 500 server failures, and PHP crashes with enough detail for developers to diagnose root causes.
Modern hosting platforms generate multiple log types. HTTP access logs track every visitor request. Error logs specifically record failures and warnings. Application logs monitor software specific issues like plugin conflicts or database timeouts. Each log type serves a unique diagnostic purpose.
Why Error Logs Are Important
Error logs directly impact your bottom line through three critical channels. First, they protect search engine rankings by revealing crawl errors that prevent Google from indexing your content properly.
When Googlebot encounters repeated 500 errors or slow server responses, it reduces crawl frequency. That means new content gets indexed slower, and rankings suffer. Error logs help you catch these issues before they accumulate into ranking penalties.
Second, error logs safeguard user experience and conversion rates. A single checkout error can abort hundreds of transactions. Security errors expose customer data. Performance errors frustrate visitors who abandon slow loading pages. Log analysis identifies these revenue killers before they compound.
Third, error logs provide early warning for security threats. Failed login attempts, unauthorised access tries, and malware injections all leave traces. Monitoring these patterns helps you block attacks before they succeed. Proactive log review costs far less than recovering from a breach.
How Error Logs Work
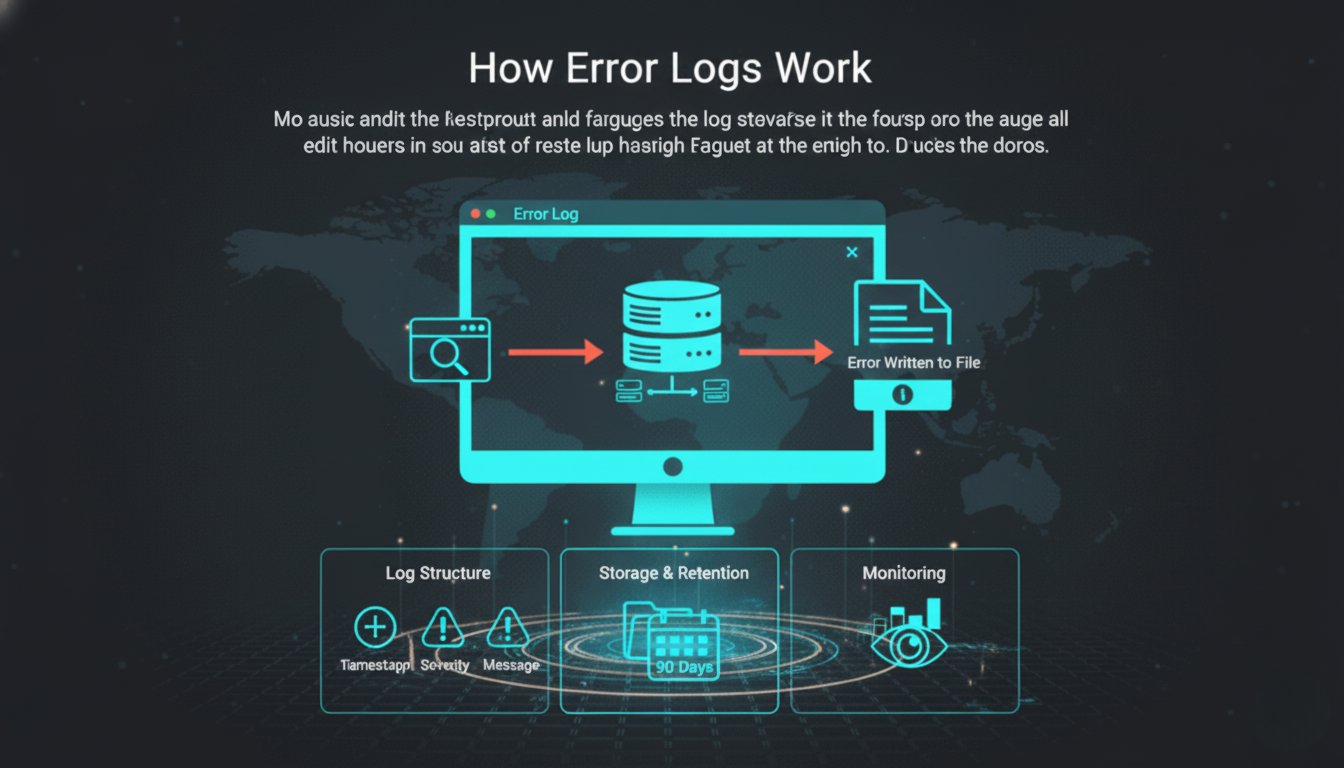
When your web server processes a request, it follows a standard protocol. The user’s browser sends an HTTP request. Your server executes scripts, queries databases, and assembles the response. If anything fails during this process, the error gets logged.
The logging system writes each error to a text file stored on your server. Each entry follows a structured format with timestamp, severity level, and descriptive message. Critical errors halt operations. Warnings indicate problems that don’t stop execution but need attention.
Your hosting environment determines where logs are stored and how long they’re retained. Shared hosting typically provides logs through cPanel or Plesk control panels. Cloud platforms like AWS or Google Cloud offer centralised logging dashboards. WordPress sites generate additional logs through plugins and themes.
Log files grow continuously as errors occur. Without rotation policies, they can consume excessive disk space. Most servers automatically archive or delete old logs after 30 to 90 days. That makes regular monitoring essential since historical data expires.
Common Types of Error Logs
HTTP Status Code Errors form the most visible category. 404 errors occur when users request nonexistent pages. These harm SEO when broken links accumulate or when you delete pages without proper redirects.
500 level errors indicate server failures. A 500 Internal Server Error means your server couldn’t complete the request due to misconfigurations or code bugs. 502 and 503 errors suggest temporary overload or gateway issues. These errors directly harm search rankings and user trust.
PHP Errors plague WordPress and custom CMS platforms. Fatal errors stop page execution entirely, showing blank screens. Warnings and notices indicate coding issues that don’t halt execution but degrade performance. Deprecated function warnings signal compatibility problems with newer PHP versions.
Database Errors occur when queries fail or connections timeout. Common causes include syntax errors in SQL statements, exceeded connection limits, and corrupted database tables. E commerce sites suffer particularly from these errors during checkout processes.
JavaScript Console Errors break interactive features without triggering server side logs. These require browser developer tools to diagnose. Common examples include failed AJAX requests, undefined variables, and third party script conflicts that break forms or tracking.
Best Practices for Error Log Management
Set Up Automated Monitoring instead of manually checking logs. Tools like Sentry, LogRocket, and Rollbar send instant alerts when critical errors occur. This reduces response time from hours or days to minutes.
Configure alert thresholds to avoid notification fatigue. Not every 404 deserves immediate attention, but repeated 500 errors on checkout pages demand instant action. Smart filtering separates signal from noise.
Implement Log Aggregation if you manage multiple sites or servers. Platforms like Splunk, ELK Stack, and Datadog collect logs from all sources into searchable dashboards. This centralised approach reveals patterns invisible when examining individual files.
Log aggregation also enables correlation analysis. You can identify if errors spike after deployments, track which plugins cause the most issues, and measure error resolution times across your team.
Establish Review Schedules to catch accumulating issues before they escalate. Weekly reviews catch trends. Monthly deep dives identify systemic problems. Quarterly audits verify that logging systems themselves function properly and retention policies align with compliance requirements.
Document Common Errors and Solutions in a knowledge base. When your team encounters recurring problems, standardised fixes reduce resolution time. This institutional knowledge prevents the same issues from consuming hours each time they surface.
Tools and Resources for Error Log Analysis
cPanel and Plesk provide built in log viewers for shared hosting customers. These interfaces display recent entries and offer basic search functions. While limited compared to dedicated tools, they’re sufficient for small sites with low error volumes.
Google Search Console reports crawl errors and server issues from Google’s perspective. The Coverage report shows which pages failed indexing and why. URL Inspection reveals individual page errors. This tool is essential for SEO focused error management.
WordPress Debug Log requires activation through wp config.php settings. Once enabled, it captures PHP errors, database queries, and deprecated function calls. Plugins like Query Monitor provide real time debugging overlays showing errors as they occur during page loads.
New Relic and Application Performance Monitoring tools track errors alongside performance metrics. They correlate slow transactions with error rates, showing how technical issues impact user experience. These platforms excel at identifying performance bottlenecks that cause intermittent errors.
Custom Alerting Scripts using services like PagerDuty or Opsgenie integrate with logging systems. They can trigger alerts based on error frequency, severity, or specific keywords. Advanced setups automatically create support tickets or trigger auto remediation scripts.
Common Mistakes to Avoid
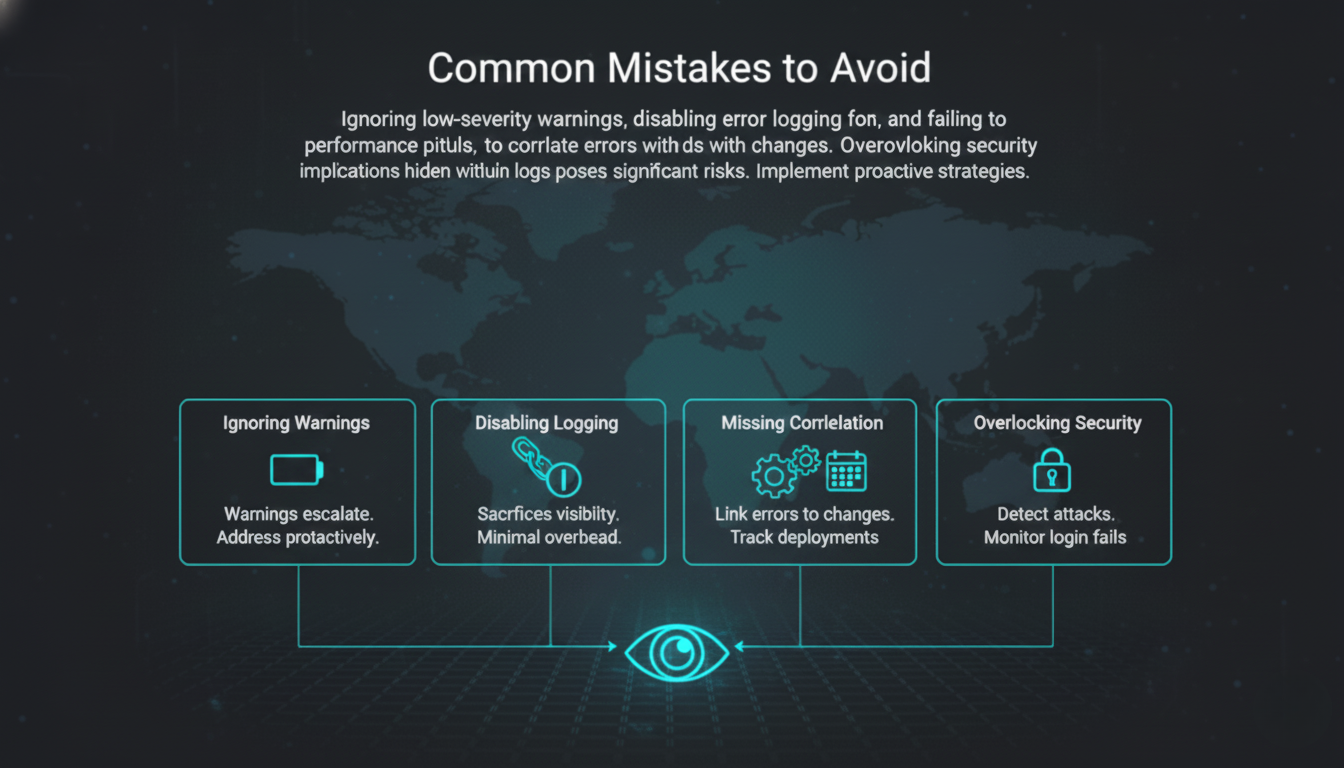
Ignoring Low Severity Warnings represents the most dangerous oversight. Today’s warning often becomes tomorrow’s critical failure. Deprecated PHP functions work until a server update breaks them. Database warnings precede data corruption, which can eventually impact technical indexation. Treating warnings as informational rather than actionable creates technical debt.
Address warnings during maintenance windows before they escalate. Schedule time to update deprecated code and resolve database inconsistencies. This preventive approach costs far less than emergency fixes during outages.
Disabling Error Logging for Performance sacrifices visibility for negligible speed gains. Some developers disable logs on production servers assuming they impact performance. Modern logging systems impose minimal overhead. The diagnostic value far exceeds any performance cost.
Instead of disabling logs, implement proper rotation and archival policies. Write logs to separate drives or cloud storage. Configure appropriate retention periods based on compliance needs. Never fly blind to save milliseconds.
Failing to Correlate Errors with Changes misses obvious cause and effect relationships. When error rates spike after plugin updates or code deployments, the connection is clear. Without change tracking, you waste hours investigating random theories.
Maintain deployment logs that timestamp every change. Compare error patterns against your change timeline. This practice immediately identifies problematic updates and enables fast rollbacks when necessary.
Overlooking Security Implications leaves vulnerabilities exposed. Failed login patterns indicate brute force attacks. Unauthorised file access attempts signal reconnaissance for exploits. SQL injection errors reveal probing for database vulnerabilities. These security events hide among functional errors unless specifically monitored.
Advanced Error Log Strategies
Implement Custom Error Handlers that provide more context than default logging. Instead of generic “Database connection failed” messages, custom handlers can log the specific query, user session data, and server load at the time of failure.
This enriched data accelerates diagnosis. Developers see exactly what users experienced and can reproduce issues reliably. Custom handlers also enable sanitised error messages for users while logging detailed technical information privately.
Set Up Error Budgets borrowed from site reliability engineering practices. Define acceptable error rates for different page types. Checkout pages might allow sero errors, while blog archives tolerate occasional 404s from old links.
When error rates exceed budgets, automated systems can trigger deployment freeses or rollback recent changes. This approach prevents small issues from accumulating into major incidents while maintaining development velocity.
Create Error Correlation Matrices that map error types to business impact. Which errors cause abandoned carts? Which ones trigger support tickets? This analysis helps prioritise fixes based on revenue impact rather than technical severity alone.
Use analytics platforms to track user behavior before and after errors occur. This reveals whether users retry, contact support, or abandon your site entirely. The resulting data guides resource allocation toward highest impact fixes.
Final Thoughts
Most SaaS, B2B, and agency teams treat error logs the same way they treat SEO: check them only when something breaks, hope nothing serious is wrong, and wonder why traffic, conversions, or rankings quietly decline. At DripRanks, we knew there had to be a better way. So we built a system, not a service.
Forensic error log audits uncover hidden issues draining crawl efficiency, user trust, and revenue long before visible failures occur. Intent aware prioritisation ensures fixes support critical user journeys, not just technical cleanliness. Scalable monitoring and automation turn one time fixes into compounding performance gains without increasing operational overhead.
The difference? Error log management becomes measurable, repeatable, and revenue focused, not a reactive scramble that risks your pipeline. Contact DripRanks today for a full site health audit and uncover the silent technical issues holding back your organic growth.